News
Job Market Report 2005: Signs of Improvement?
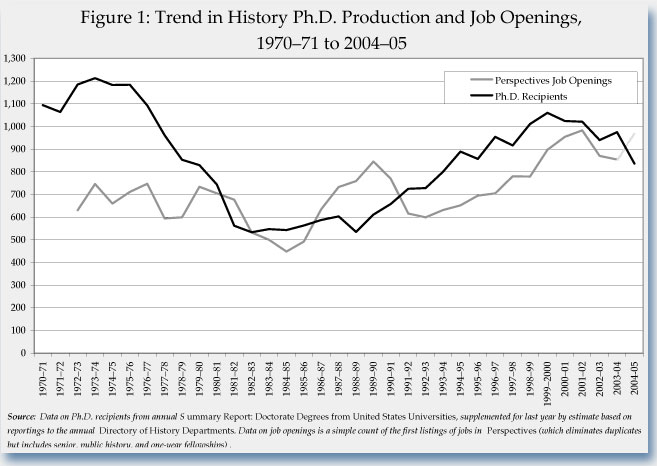
The number of job advertisements posted in Perspectives in the academic year 2004–05 surpassed estimates of new history PhDs for the first time in 15 years.
After two years of declines, the total number of positions advertised in Perspectives in the 2004–05 academic year increased 13.1 percent over the year before (Figure 1).1 The number of positions advertised last year, 966 in all, was second only to the academic year 2001–02, when 983 positions were listed.
At the same time, the number of new history PhDs reported to the AHA's Directory of History Departments academic year 2004–05 dropped 13.6 percent from the year before. That steep fall may be reflected also in what the federal government will report when it publishes the annual Survey of Earned Doctorates (SED). Extrapolations based on the Directory data and past comparisons with SED data suggest that we can expect the federal figure to be 840 history PhDs earned in the academic year 2004–05.2 If that forecast bears out, it will represent the lowest number of new history PhDs in 12 years—that is, since 1993–94, when only 800 history PhDs were conferred.
The data and the resultant projections have to be read with an enormous amount of caution, however, as four trends suggest this could just be a transitory moment for the academic job market. Over the past five years, the number of graduate students entering history PhD programs has been rising, while the proportion of faculty approaching retirement has been falling. And looking forward, the U.S. Department of Education anticipates that the recent growth in the number of new undergraduate students at American colleges and universities will slow down over the coming decade—about the time it would typically take someone just starting a history PhD to finish.3
The other uncertain factor in the mix is a large number of recent history PhDs who did not find full-time employment in recent years, and remain on the academic job market or might be tempted to re-enter it. The faculty listings in the latest Directory clearly show that the proportion of newly hired junior faculty who had received their PhDs less than three years before appointment (the traditional window over the past decade) is decreasing. Among new assistant professors hired last year, for example, just 60 percent were either PhD candidates or had received their degree within the past three years. This is a marked drop from past years, when this proportion was typically around 80 percent.
One other area we cannot properly measure is the number of job openings outside of the four-year college and university market, which also provide good career options for new history PhDs. Aside from the lack of data on this question, doctoral programs in the discipline rarely prepare their students for careers in two-year colleges and public history. This is unfortunate, though, because these continue to be important growth areas in jobs advertised and in the number of history PhDs employed there.
At a fundamental level, then, the recent problems in the history job market appear to have stemmed from an imbalance in the way PhD programs admit students, train them, and value their potential career options. This is hardly surprising, as few PhD programs systematically keep track of where their PhDs go on to find employment.4 And PhD programs are further insulated from the four-year college job market because PhD-granting departments rarely hire newly minted history PhDs (preferring to cherry pick mid-career faculty from other schools).5 Given their limited exposure to the vicissitudes of the job market for which they are training their PhDs, we hope PhD programs will nevertheless exercise caution as they consider how to adjust their admissions decisions to the information presented below.
Job Ad Growth in All Categories
The number of new junior faculty positions—jobs advertised as open to faculty at the instructor or assistant professor level—rose 17.6 percent, from 682 jobs in the 2003–04 academic year to 801 in 2004–05. This represents the largest number of junior faculty jobs listed since we began differentiating jobs more precisely by academic rank in 1991–92.6 Alongside the junior faculty jobs, another 59 of the listings were for postdoctoral fellowships, which could provide other short-term opportunities in academia to recent history PhDs. An additional 34 public history positions were advertised.
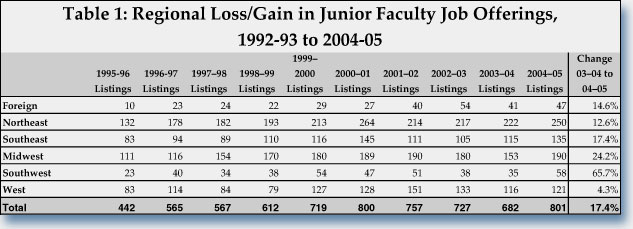
The increases in the number of positions occurred in all regions of the country and in all geographic fields of specialization (Tables 2 and 3). The most pronounced growth occurred in the Southwest, where the number of junior faculty jobs increased almost 66 percent over the year before (from 35 to 58 jobs). In simple numeric terms, the largest growth occurred in the Midwest, where an additional 37 junior faculty jobs were advertised.
In recent years it has become more apparent that a large segment of new history PhDs can or will only apply for positions in a limited number of regions—particularly the region in which they received their doctorate. So it is somewhat troubling that job growth lagged a bit in the Northeast and West, where more than half of the new PhDs received their degrees. The proportion of junior faculty jobs advertised in each of those regions was slightly lower than the proportion of new history PhDs recently conferred in that region. In contrast, in the Southeast, departments advertised almost 18 percent of the jobs for new faculty, but PhD programs conferred barely 15 percent of the new PhDs.
Of course, the total number of jobs and where they are is somewhat less important than the actual alignment of specific field specializations. Unfortunately, we cannot offer a precise comparison of the field specialization of new history PhDs to the field specializations requested in the job advertisements.
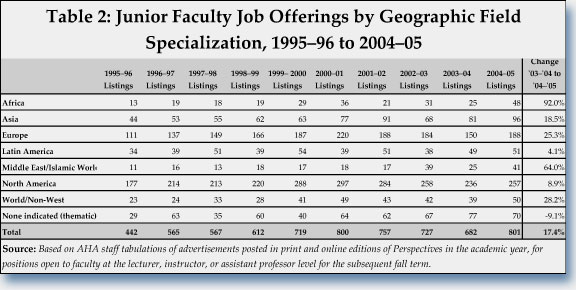
We can report that the number of new junior faculty jobs advertised in each of the major geographic categories did grow (Table 2). Positions in African history led the way, rising 92 percent from the year before, followed closely by openings in the Middle Eastern and Islamic history, which rose 64 percent.
Openings in U.S. and European history continue to account for more than half of the jobs listed last year, but their proportion of the advertised positions has been declining over the past decade. To account for year-to-year fluctuations, it helps to look at the past three years in comparison to the last three years of the 1990s (from September 1997 to May 2000). Over the past three years U.S. history averaged 34.1 percent of the junior faculty listings, as compared to 37.9 percent of the listings in the late 1990s. Similarly, European history jobs have fallen from an average of 26.5 percent of the positions advertised to 23.6 more recently.
This is troubling. By most estimates, more than half of the new history PhD recipients in recent years specialized in some aspect of U.S. history—with a majority working on the past 100 years. Moreover, the number of new history PhDs specializing in U.S. history has been growing in recent years. In comparison, only about one-quarter of the recent PhDs were conferred on students working in European history, and that portion has been declining.7 As this suggests, recent PhDs working on regions outside of the U.S. and Europe are likely to find less competition for jobs in their field.
One other important point of distinction is in the preference for (or, more accurately, the expectation of) employment in a major research university. Less than half of the junior faculty jobs were in universities rated as doctoral/research universities, and barely a quarter were in departments that met the National Research Council's criteria for ranking PhD programs 12 years ago.
History Departments Continue to Grow
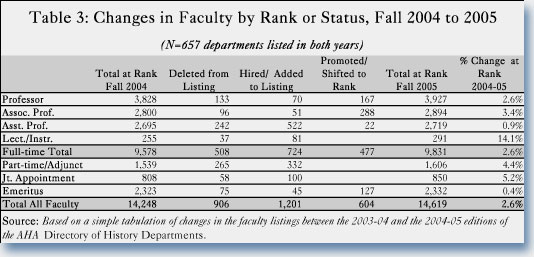
To take a better measure of how the job listings translate into actual jobs, AHA staff tabulated the faculty listings in the latest Directory. As in recent years, the most notable change is the small incremental growth in the number of faculty employed in the 657 departments listed in the past two directories (Table 3).
Of course, the hiring of new faculty in the departments tends to arise from three purposes connected to the classroom—the need to replace retiring faculty, the need to find teachers for a growing number of students in the classrooms, and finally, the need to provide new coverage of emerging subject fields. The trends among faculty listed in the Directory provide some evidence on these questions.
In relative terms, the growth in the use of part-time faculty outpaced the growth in the number of full-time faculty for the third year in a row. The number of full-time faculty at all levels in these departments grew 2.6 percent, while the number of part-time faculty grew by 4.4 percent.
The increases in the number of new faculty seem largely driven by recent increases in the number of undergraduate students studying history. Given the estimates from the Department of Education that the growth in the number of undergraduate students will taper off over the coming decade, departments may be encouraged to hire part-time and contingent faculty (because their numbers can be adjusted more easily to adapt to changing student recruitment patterns).8
While the growth in the number of undergraduates is clearly an important element in the recent increase in the number of faculty in the departments, much of the recent expansion in hiring has been necessitated by a growing number of retirements over the past decade. This is perhaps best indicated by sharp increases in the number of emeritus faculty over the past decade. Ten years ago fewer than 700 faculty were listed in the emeritus category; now they number more than 2,300. It is worth noting, however, that this trend is slowing after a decade of annual growth of more than 7 percent. The number of new emeritus faculty went up this year only by a modest 0.4 percent.
Taking a closer look at the faculty listed in the Directory, and more specifically at when they received their degrees, the generational shift that has taken place becomes more evident. Given that the average age when historians receive their PhDs has consistently been above 30, we classify the full-time faculty into the decades since they received their degree. While imperfect, such a classification does allow us to estimate how many faculty are approaching retirement relative to the number who are still quite early in their careers (Figure 3).
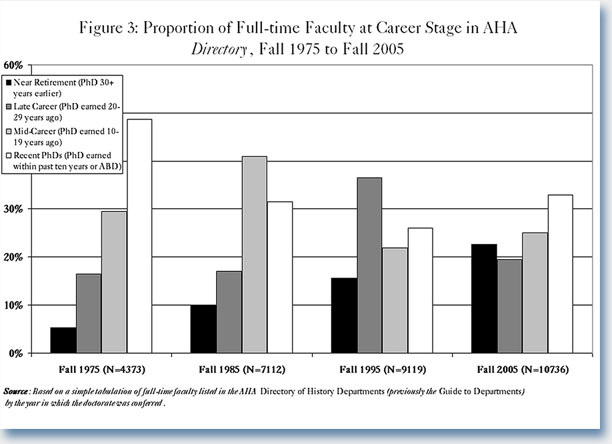
A decade ago more than half of the full-time faculty listed in the Directory had received their doctorates more than 20 years earlier (and hence assumed to be past their mid-50s). In the most recent Directory this number has now fallen to 42 percent. While the pool of history faculty approaching retirement age is by no means exhausted, this is very near the lowest point in more than 20 years.
If we look back to the first year for which we have comparable information, 1975, we can see both why there has been a recent wave of retirements and why doctoral programs need to rein in any optimism that may arise about the future prospects for the academic job market. In the first edition of the Directory (then called the Guide to Departments of History) almost 80 percent of the faculty had received their doctorates within the previous 20 years, almost half within the prior decade.
In many ways, 1975 marked a painful turning point for the discipline. As indicated in Figure 1, in the early 1970s departments were conferring many more degrees than the available jobs in departments, leading to a job crisis that actually dwarfs the more recent troubles in the field. Even though the problems in the academic job market had been clearly identified by 1970, and departments sharply cut back on their admissions of new doctoral students, because of the large numbers of doctoral students admitted in the late 1960s and the lengthy process to earn a history PhD, the numbers of new history PhDs did not begin to decline until the middle of the decade.
Looking at the cohorts of personnel listed this year, we can see that the professors who earned their degrees before 1976 now comprise 23 percent of the full-time faculty, with a relatively steep drop-off in the proportion who earned their degrees in the following decade (between 1976 and 1985). So while the cohort approaching retirement has reached the largest point in our records, there is also evidence that it will not sustain over the longer term.
Nevertheless, there is certainly good news in the rising number of faculty promoted to the full and associate professor level in history departments. Promotions to these higher ranks has been growing over the past few years, as the historians hired in increasing numbers into junior faculty positions over the past decade are now earning tenure and moving up in the ranks.
Decline in New PhDs, but Admissions and Student Numbers on the Rise
The laws of supply and demand apply to the job market as well; so, if one looks at the current numbers of students earning degrees and seeking jobs, the news seems quite positive.
The number of new PhDs reported to the Directory for the 2004–05 academic year fell almost 14 percent from the year before. With the exception of the modest uptick last year, the number of new PhDs conferred has declined annually since the 1999–2000 academic year, and is now 20 percent below the levels of five years ago.
The declines over the past five years have been fairly evenly distributed across most demographic categories—public and private institutions, programs at the top and the bottom of the various rankings, and in all regions of the country. The only category that seems significantly different from the norm is of programs that were not ranked by the National Research Council (NRC) in 1993 or by U.S. News and World Report last year. Typically they were not ranked because they were either newly established or too small to meet the criteria for inclusion.
While the number of PhDs conferred in the ranked programs have all declined more than 16 percent over the past five years, the doctorates earned at the unranked programs fell a more modest 5.9 percent. It is important to note that these programs comprise only a very modest portion of the new PhDs earning degrees—just 8.9 percent of the doctorates conferred over the past five years.
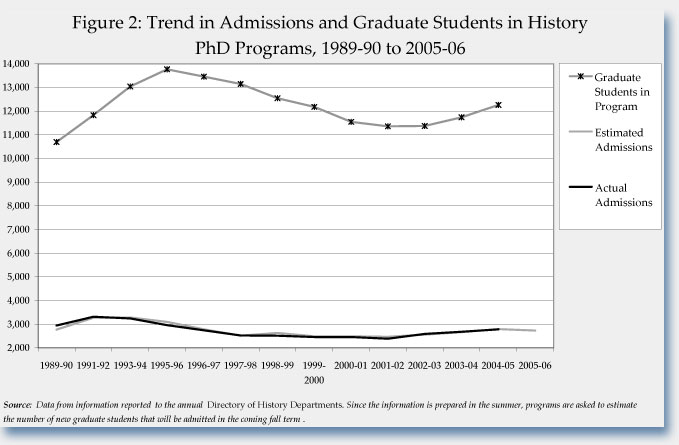
Despite the recent declines, it is important to also look at trends in admissions into the PhD programs, where the number of new students has been on the rise at most programs over the past five years. The estimate for the number of new graduate students that would matriculate this fall was 11 percent higher than the number of students who entered in the 2000–01 academic year.
Programs in the top tier of the NRC rankings have continued to limit the number of new graduates entering their programs. They anticipated admitting 2.9 percent fewer students than five years ago for the fall 2005 term. In contrast, the other ranked programs estimated that the number of new graduate students admitted would be 21.3 percent higher.
As a result of the recent increases, the number of graduate students reported as "actively enrolled" in PhD programs has risen to its highest total since the fall of 1999. Departments reported 12,264 graduate students in their programs. Of these students, 10,098 were enrolled full time and 2,166 were enrolled part time.
Not all of these graduate students are on their way to doctoral degrees, of course, so we cannot specifically predict the number of PhDs that will be conferred in the near future. Moreover, recent PhDs have spent more than nine years in graduate studies after the bachelor's degree. While only some of those are typically spent in the specific doctoral program, the great majority of that time is spent in doctoral studies. So it is no surprise that number of admissions to the PhD program is a lagging indicator.
Nevertheless, it seems clear that within a few years the number of PhDs conferred is likely to increase again modestly. Given some of the other indicators for the academic job market, departments must deliberate more carefully about how many students they will admit and what types of jobs they will prepare their students to take.
—Robert B. Townsend is assistant director for research and publications at the AHA and a doctoral candidate in history at George Mason University. Liz Townsend assisted with the tabulation of data from the 2005–06 edition of the Directory.
Notes
1. The count of total positions includes all full-time appointments designated as lasting nine months or more and fellowships paying $25,000 or more per annum.
2. There are a number of different methods for counting the number of new history PhDs; we tend to take the numbers reported in the federal survey of earned doctorates as the best measure of the number of new history PhDs. This number tends to be about 9 percent higher than the numbers reported to the Directory because new PhDs can (and do) self-select the field in which they received their degrees. This larger number suggests in addition that new PhDs who earned their degrees in other departments (in American studies, for example), will also be competing in the history job market.
3. William J. Hussar, Projections of Educational Statistics to 2014 (Washington, D.C.: NCES, 2005).
4. See, for instance The Education of Historians for the Twenty-first Century (the report of the AHA's Committee on Graduate Education). Anecdotal evidence provided by directors of graduate studies to the author supports the report's contentions. The AHA's web pages dedicated to collection and dissemination of information on history doctoral programs are intended to eventually facilitate, among other things, the tracking of post-PhD career trajectories.
5. For more on this issue, see Robert B. Townsend, "New Study Highlights Prominence of Elite PhD Programs in History," Perspectives (October 2005), 16–17.
6. The categories and tabulations were first developed by the AHA's vice president for professional issues, Susan Socolow, and reported in "Analyzing Trends in the Job Market," Perspectives (May/June 1993). Regrettably there is a one year gap in the 1994–95 academic year, which is why we do not show a tabulation back to the beginning.
7. See Robert B. Townsend, "Survey Shows Marked Drop in History PhDs" Perspectives 44:2 (February 2005) and Robert B. Townsend, "Job Market Report 2001: Openings Booming ... but for How Long?" Perspectives 40:9 (December 2001), 5.
8. See Robert B. Townsend, "Rising Tide of History Undergraduates Contrasts with Declining PhDs," Perspectives (December 2005), 8.
Tags: Job Markets
Comment
Please read our commenting and letters policy before submitting.

