News
Challenges for History Doctoral Programs and Students: Rising Admissions and High Attrition
The number of students entering doctoral programs is rising, according to data submitted to the AHA in 2007 by history PhD programs. The data also indicate that after 10 years in the program, fewer than half of the students who started their doctoral studies in 1997–98 had received their degrees and nearly a third had dropped out altogether.
The information was collected in summer 2007 from 164 U.S. and Canadian history programs (out of the 184 programs listed in our History Doctoral Programs in the United States and Canada database). The departments that responded to the survey reported that in the 2006–07 academic year they had 8,529 doctoral students in their programs—7,858 in the United States, and 671 in Canada.
This number appears likely to increase as the departments seem intent on increasing the number of students in their programs. U.S. history PhD programs reported an average of 80.9 applications per department for the 2007–08 academic year (up from 74.1 applications the year before). Because the departments reported over the summer, they could only provide estimates of the number of students that would matriculate in the fall, but they anticipated that an average of 9.2 students would matriculate into each program (up slightly from 9.1).
The Canadian programs surveyed reported a decline in the number of applications—24.8, down from 31.9 the year before. Nevertheless, these departments also expected to matriculate more students than the previous year—an average of 6.0 students, up from 5.3 students.
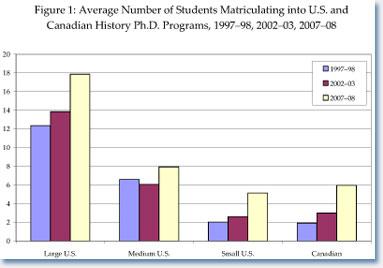
In both U.S. and Canadian programs the average of 9 students expected to enter history doctoral programs was significantly higher than the numbers that entered five and ten years earlier (Figure 1). In the academic year 1997–98, those same programs matriculated an average of just 5.53 students, a number that increased to an average of barely 6 students in 2002–03. In real terms, the North American programs responding to the survey planned to add 1,476 students, which was up from 924 students 10 years earlier.

In proportional terms, the largest growth in the number of new doctoral students entering programs occurred at small U.S. programs (that is, programs that conferred fewer than 2.5 PhDs over the past three years) and Canadian programs, where the average number of students matriculating more than doubled from two to a bit more than five students. But in real terms, the greatest growth occurred at the large U.S. programs, where the average number of new students grew from 12.4 matriculates in 1997–98 to 17.9 in the current academic year.
The number of new students entering these programs provides an early measure of the number of doctoral students who will be earning PhDs eight years down the road (the average time spent earning the PhD). So the rising admission rate points to significant increases in the number of conferred PhDs after 2015.
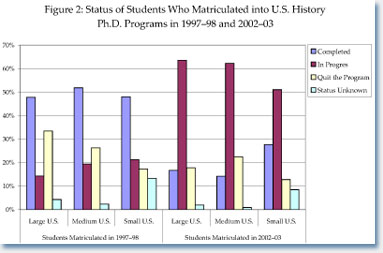
But one of the factors that should figure into this equation is the attrition rate from PhD programs, which is much more difficult to measure. Programs use different measures to determine when a graduate student in the department is considered a doctoral student, and they are often reluctant to concede that a student is no longer pursuing the degree. Nevertheless, when we asked the departments to indicate the status of students who matriculated into the program five and ten years earlier, we found that fewer than half (49 percent) of the students in U.S. programs had completed their degrees after 10 years. And there appeared to be relatively little difference in the completion rates between the larger and smaller programs in the United States (Figure 2). Only the Canadian programs reported a significantly higher 10-year completion rate, with 57 percent of their students shown as completed after 10 years.

The attrition rate after 10 years appears to be modestly higher at the larger programs, as 38 percent of the students who matriculated in 1997–98 left their programs or their status was no longer known to the department—just 14 percent were considered still "in progress" after 10 years. In comparison, at the smaller schools, 22 percent of the students who matriculated a decade earlier were still considered to be pursuing the degree.
The number of students reported as still pursuing the degree after 10 years seems quite large—given that many programs publicly maintain a seven- or eight-year graduation requirement. This also begs the question of when and if the students still considered to be working on the degree after 10 years will ever finish their degrees. Our survey will not be able to resolve that question.
But by aligning the snapshots of students from the 1997–98 and 2002–03 cohorts, we can see that a significant amount of attrition occurs fairly early in the process, at least in U.S. programs. At the five-year mark, an average of 21 percent of the students had left the program. This was more than half of the proportion of students that had quit at the 10-year mark (33 percent). In comparison, among students in Canadian programs attrition seems to occur later in the process. Just 11 percent of the Canadian doctoral students quit at the five year mark—barely a third of the 39 percent reported as departed after a decade. These comparisons need to be read with care, since they are drawn from snapshots of different cohorts of students, but they do provide useful reference points for assessing when and why students leave their programs.
Hopefully, as we continue this survey over the coming years, we will be able track each cohort as it passes through the five- and ten-year mark.
—Robert Townsend is the AHA’s assistant director for research and publications.
Tags: Student News
Comment
Please read our commenting and letters policy before submitting.


