News
What Do We Know about History PhDs?
Among the more frequently asked questions put to staff of the AHA is how many people apply to history PhD programs, and how many of them actually make it all the way through the program. To try to get a handle on these questions, this past summer we added a few more items to the list of questions we send to departments when we collect information for the annual Directory of History Departments, Historical Organizations, and Historians.
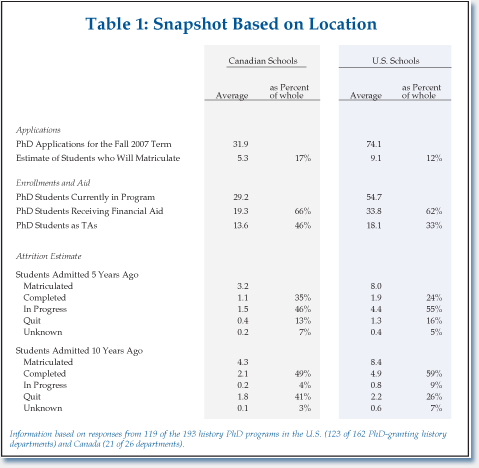
The results are a bit surprising. The average department in the United States received 74.1 applications and intended to matriculate 9.1 students (Table 1). The Canadian departments that responded to the survey (21 of the 26 PhD programs listed in the Directory) received an average of 31.9 applications and accepted 5.3 students.

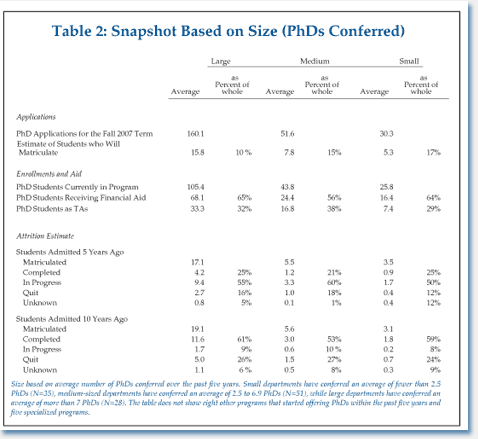
The larger programs (based on the number of PhDs conferred) reported much larger numbers of applicants, but only a slightly smaller admission rate than smaller programs (Table 2). The largest programs received an average of 160.1 applications, and only expected about 10 percent (15.8 students) to matriculate. Smaller programs received an average of 30.3 applications and expected almost 17 percent of them to matriculate.

Attrition rates are much harder to track, as departments seem to use widely differing formula about when they actually count a student as in the program. But using the very rough measure of asking where students who matriculated into the program 5 and 10 years ago now were in their programs, we did obtain some rough estimates for departments (and potential students) to ponder.
On average, among students who entered PhD programs 10 years ago, 59 percent had completed the degree, 9 percent were still working on them, 26 percent had quit, and another 7 percent could not be accounted for. Programs in Canada reported a slightly higher attrition rate, as only 49 percent had completed the degree 10 years into the program, while 41 percent quit.
The attrition rate among students in PhD programs five years after matriculation suggests some ambiguity about when the decision to quit occurs in the process. An average of 16 percent of the students who matriculated in U.S. institutions five years ago had left the program—more than half of the proportion who had quit at the 10-year mark. Among the students in Canadian programs, the attrition seems to occur later in the process, as just 13 percent of the students quit by the five-year mark—barely a third of those gone after a decade.
The other question that tends to generate some interest concerns the number of doctoral students receiving some kind of financial aid. From past experience with the report of the Committee on Graduate Education (online at www.historians.org/projects/cge/2004/Report/index.html), we know institutions vary widely in the way they count their support to graduate students. To try to approach a number that would work across institutions, we simply asked how many students were receiving some form of aid. As indicated below, almost two-thirds of the doctoral students are receiving some form of financial support (62 percent in U.S. programs, 66 percent in Canadian programs).
—Robert B. Townsend is the AHA's assistant director for research and publications.
Tags: Graduate Education
Comment
Please read our commenting and letters policy before submitting.


