News
NRC Report Provides Data on History Doctoral Programs
The National Research Council (NRC) released the latest in its roughly decennial assessment of research doctoral programs, and its findings provide a treasure-trove of historical data on the activities of history PhD programs.1 Whether the NRC rankings of those programs merit similar acclaim probably depends on where your department ended up.
The information on history doctoral programs is slightly dated, since it relies on data from the 2006–07 academic year. And the NRC information is muddled a bit by the inclusion of a number of highly specialized programs (such as history of science) alongside departments that include multiple subject areas. For clarity, this analysis will exclude specialized programs, and focus solely on the 123 history departments in the NRC report. Note that this does not include all history departments with PhD programs. The AHA’s database of history doctoral programs shows 152 departments conferring the PhD, but the NRC excluded programs at universities that chose not to participate in the survey or had conferred fewer than five PhDs between 2000 and 2006.
The NRC report gains most attention for its rankings of the doctoral programs, which are based on the views of scholars in the discipline. These rankings are based on two polls: one that surveyed program reputations and another that first asked scholars in the discipline to determine the relative weights of significant and objective measures of achievement within each department, and then used those for calculating more objective rankings. Taken together, the two types of measurement offer something of a diffuse cloud of rankings that make it nearly impossible to construct a simple tabular list of the “best programs” in history.
The lack of a clear hierarchy of history programs is for the best, since what makes one program measurably better than another generally depends on the specific field of specialization and who is asking the question. Broken into four broad tiers, the reputation rankings and the supporting data in the report provide a useful way of analyzing some of the characteristics that may set one doctoral program apart from another—ranging from the production of new scholarship by faculty members to the departments’ support for students and their goals.

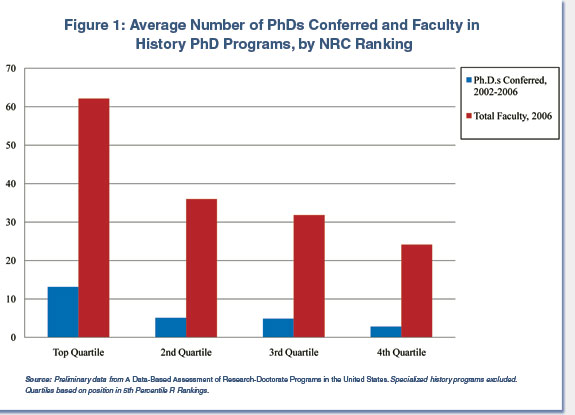
The most prominent characteristic of programs in the top half of the reputational rankings is size. Two-thirds of the top-ranked programs are the largest in the discipline measured by faculty and student population (Figure 1). Programs in the top quarter of the rankings have an average of 62 faculty members, and annually conferred an average of 13.1 PhDs from 2002 to 2006. In comparison, programs in the bottom quarter of the rankings had an average of barely 30 faculty members and conferred an average of less than five PhDs per department each year.
The type of institution housing the department did not seem to make a significant difference in the upper ranks, as programs in the top half of the rankings were evenly split between public and private institutions. Departments in the lower-half of the reputational rankings, however, were significantly more likely to be in public universities—accounting for 79 percent of the bottom ranked programs.
Student Issues
The rankings show some significant qualitative differences for doctoral students. Judged solely by GRE scores, students entering top-ranked programs from 2004 to 2006 seemed better qualified than students entering programs at the bottom of the rankings. Students at programs in the top quarter of the rankings had an average of 652 on the GRE’s, as compared to an average score of 578 for students at programs in the bottom quarter.
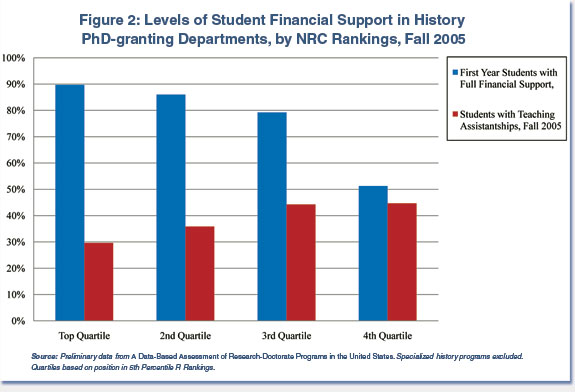
And students at the top-ranked programs also enjoyed significantly more support for their studies. An average of 90 percent of the first year students at top-ranked programs in fall 2005 had full support for their studies, as compared to an average of 51 percent of the students at programs in the bottom quarter (Figure 2).

Students at the top-ranked programs were also more likely to have fewer strings attached to their support, which might impede their studies. An average of 10 percent of the students in programs in the top quarter of the rankings had external funding support for their studies, while none of the students in programs at the bottom of the rankings enjoyed such support. Students at departments in the bottom quarter of the rankings were much more likely to support their studies with teaching assistantships. In fall 2005, an average of 45 percent of the students in bottom-ranked programs had teaching assistantships, as compared to 30 percent of the students at top-ranked programs.
Students at the programs in the top-ranked programs were also significantly more likely to have other benefits as well, such as work spaces allocated to their use and health insurance provided by the institution.
Despite these apparent advantages for students at departments with the best reputations, there was relatively little difference in the average time-to-degree and completion rates between the different programs.
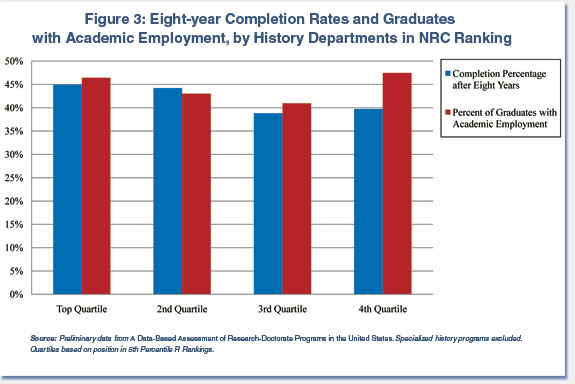
Among students in all history PhD programs, the completion rate after eight years averaged just 42 percent in all reporting departments. Completion rates at programs in the lower half of the reputational rankings seem only modestly lower than at departments in the top tier—40 percent as compared to 45 percent (Figure 3).

The actual completion rate is certainly higher than these figures suggest. Students who had completed their programs spent an average of 7.46 years in their studies, which indicates that a large proportion of the students completed their degrees after the eight-year window used for the study’s completion figure.2
Regardless of the low completion number, there was very little variation in time-to-degree for students across the departmental rankings. Students from programs at top-ranked programs completed their studies in an average of 7.41 years as compared to an average of 7.44 years for students from departments in the bottom quarter of the rankings.3
Despite the other disadvantages of students in the lower-ranked programs, one of the more remarkable findings in the report is that there is very little variation in the proportion of students who reported academic employment at the time they earned their degrees. Among students who earned their degrees between 2001 and 2005, an average of 46 percent of the students at programs in the top quarter of the rankings had a contract “with an educational institution” at the time they earned their degree. In comparison, an average of 47 percent of the students from programs in the bottom quartile were similarly situated. The average for students from programs in the middle tiers was actually slightly lower than the programs at the top and bottom of the rankings.
This reinforces findings from earlier AHA studies which suggested that the smaller and less prestigious programs serve a vital niche market—feeding faculty into positions at small two- and four-year institutions, particularly in the interior of the country, which students from elite programs would not consider.4
Faculty Productivity and Support
Not surprisingly, the differences between the departments in the top and bottom tiers were also marked by the faculty’s level of productivity and support for their research. Faculty members in programs in the top quarter of the programs published an average of 13.2 publications (defined broadly) each in the seven-year period from 2000 to 2006. In comparison, faculty members in programs at the bottom quarter had published an average of 9.3 publications over the same span.
Faculty in the top-ranked departments also earned a much larger number of awards to recognize their research. As of 2006, the faculty members in programs in the top tier of programs had earned an average of 3.9 “prestigious” or “highly prestigious” awards. Faculty in programs in the bottom quarter of the rankings had earned an average of 0.5 awards.
Faculty in upper-level programs also enjoyed a higher level of support for their research. An average of 21.2 percent of the faculty in departments in the top quartile had grants to support their research in 2000, as compared to an average of 16 percent in programs in the bottom quartile.
These differences are partially due to the demographics of the elite departments as compared to their lower-ranked peers. Departments in the top quarter of the rankings have a higher proportion of tenured senior faculty and a lower proportion of junior faculty. This is hardly surprising, as the wealthier and more prestigious schools often use the lower-ranked programs as a sort of farm team, hiring away the senior faculty after they publish significant work in the field.
Demographics of Faculty and Students
The survey offers some additional demographic data on doctoral programs in 2006. In that year, 34 percent of the faculty and 43 percent of the students in the department were women. There was little variation in the representation of women among the faculty among the different tiers of the rankings, but the student populations at departments in the bottom half of the rankings were significantly less diverse. On average, almost 50 percent of the doctoral students in programs in the top half of the rankings were women, as compared to an average of 39 percent of the students in programs in the bottom half of the rankings.
In comparison, there was very little variation in the representation of racial and ethnic minorities among faculty and students in the different strata of history doctoral programs. The NRC data excludes minorities of Asian descent, but shows that an average of 11 percent of faculty in these departments were members of a “Non-Asian Minority” in 2006. There was very little variation among departments at the top and bottom of the rankings.
The representation of non-Asian minorities among students who were citizens and permanent citizens in fall 2005 was similar to the faculty—averaging 12 percent in history doctoral programs. The representation of minorities in the student population was higher than the faculty in top-ranked programs (averaging almost 15 percent). Programs in the bottom half of the rankings were less diverse than their counterparts at the top of the rankings (averaging less than 10 percent of the doctoral student population).
These are the major gleanings from the preliminary data tables. When the data is finalized, staff at the AHA will prepare a further study comparing the history doctoral programs to PhD-granting departments in other disciplines.
Robert B. Townsend is the Association’s assistant director for research and publications.
Notes
1. Jeremiah P. Ostriker, et al, A Data-Based Assessment of Research-Doctorate Programs in the United States (Washington, D.C., National Research Council, 2010). The data tables and related methodology reports can be found online at www.nap.edu/rdp/ . For a quick look-up of data about specific departments, see PhDs.org, an independent web site not affiliated with the National Research Council that has incorporated data from the research-doctorate assessment into its Graduate School Guide.
2. The NRC uses two different ways of measuring completion and time-to-degree that may make it confusing to understand. The completion rate was calculated by looking at how many of the students who entered doctoral studies between from 1996-97 to 1998-99 had completed their studies within an eight year window. The time-to-degree figure was calculated by looking back to the start date of all students who received doctoral degrees from 2003–04 to 2005–06.
3. This is lower than the average of around 9 years shown in the annual Survey of Earned Doctorates (SED), as reported in Robert B. Townsend, “History PhDs Grow in Number and Diversity in 2007–08,” Perspectives on History ” (January 2010, online at historians.org/Perspectives/issues/2010/1001/1001new2.cfm). This is due to the different methodology of counting, since the data for this report is collected from departments, while the data for the SED is collected directly from the new PhDs (who are told to include time spent in other graduate programs).
4. See for instance Anthony Grafton and Robert B. Townsend, “The Parlous Paths of the Profession,” Perspectives on History (September 2008) available online at historians.org/perspectives/issues/2008/0810/0810pro1.cfm.
Tags: History News
Comment
Please read our commenting and letters policy before submitting.


