News
History PhD Numbers Lowest in Almost a Decade as Job Listings Continue to Rise
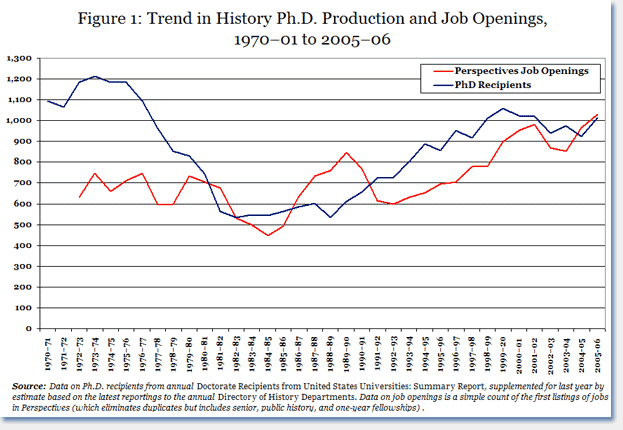
According to a new federal survey, the number of history PhDs conferred in 2005 fell to the lowest level in almost a decade—down to 924 degrees from 975 the year before—and it appears the number of history jobs postings in 2005–06 surpassed the number of new PhDs for the second year in a row.
The annual Survey of Earned Doctorates, gathered by the National Opinion Research Center (NORC) for five federal agencies, points to a number of other items of good news, as the proportion of history PhDs with "definite employment" and the proportion of women and foreign students receiving degrees also increased.
Notably, the number of history PhDs conferred declined even as the number of new PhDs awarded in all fields rose 2.9 percent, to reach a new high of 43,354 degrees.
History PhDs and the Academic Job Market
The trends in the number of new history PhDs are watched particularly closely for their fit with the academic job market, and the news there continues to be fairly positive (Figure 1). The number of jobs advertised in Perspectives in 2004–05 was more than 5 percent higher than the number of new PhDs—the first time openings exceeded PhDs in 15 years.

This beneficial gap was reflected in the employment statistics of the new cohort of history PhDs. Among the new degree recipients in 2005, 56.7 percent reported "definite employment" when they received their degrees. Ten years ago, just 46.9 percent of the new PhDs reported a job in hand.
The proportion still "seeking employment" also fell to 30.1 percent. The remaining 14 percent who are unaccounted for were either entering some kind of postdoctoral study, were still negotiating a contract, or lacked any definite plans for employment.
As indicated in Figure 1, the number of new PhDs increased sharply in the latest (2006–07) edition of the Directory of History Departments, Historical Organizations, and Historians (which would correspond to the 2006 cohort of PhDs in the federal survey). Based on the number reported in the Directory, we estimate that the next federal survey is likely to show a rise back above 1,000 new history PhDs.
Such an increase is likely to be only a temporary phenomenon, however, as the number of dissertations in progress listed in our online database remains near its lowest level in the past 10 years. We currently list 3,327 dissertations in progress, which is only up modestly from the recent low of 3,192 recorded two years ago—and still well below the high of over 4,000 reported in fall 1997.
Last year's surge in the number of PhDs awarded was probably connected to the recent increase in job advertisements. A number of PhD candidates told us in informal conversations and correspondence that they were prompted by the noticeable rise in the number of jobs in their fields as incentive and encouragement to hurry up and complete their dissertations.
Fortunately, the number of jobs listed in Perspectives in 2005–06 largely managed to keep pace, rising to over 1,000 listings for the first time in our tabulations of jobs listed. History departments and other organizations listed 1,030 positions last year—well above the previous peak of 983 positions in the 2001–02 academic year.
As in years past, the history PhD still tends to be seen rather narrowly as a credential mainly for employment in academia. Among the new PhDs in the 2005 cohort, 84.8 percent of those with definite employment plans were taking academic jobs.
Geographic Field Specializations
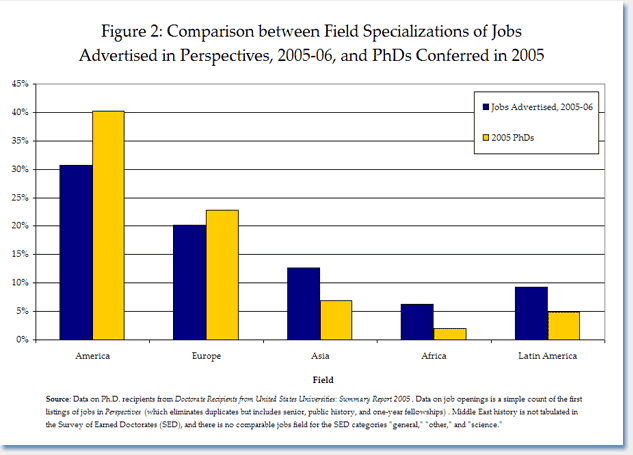
Juxtaposing the field specializations of new PhD recipients indicated in the NORC report with the jobs advertised in Perspectives last year demonstrates some of the balance problems in the academic job market for history (Figure 2).

American history remains the dominant field for new history PhDs, comprising 40.1 percent of the 2005 cohort. But only 27.6 percent of the jobs advertised in Perspectives last year were designated for a specialist in American history. The balance was slightly better for European history, as 22.8 percent of the new PhDs were specializing in that broad field, while 20.8 percent of the jobs were asking for a specialist in the field.
In comparison, the balance for the fields of Asian, African, and Latin American history seemed to be on the demand side, with a larger proportion of jobs than PhDs. For instance, African history was specified for 6.3 percent of the jobs, while Africa specialists only comprised 1.9 percent of the new degree recipients.
The balance was a bit closer in Asian and Latin American history, though still quite favorable to those seeking jobs. Latin American history was designated in 9.3 percent of the openings, while just 4.9 percent of the degree recipients were in the field. Similarly, 12.7 percent of the advertisements were targeted to Asian history, while just 6.9 percent of the degree recipients were working in the field.
These numbers are not perfect measures by any means, as they fail to account for the large proportion of both degree recipients and jobs advertised that do not fit into one of these geographic categories. Among the job listings, 13.4 percent of the openings specified that the search was not limited to those specializing in a particular geographic area. Similarly, 18.5 percent of the 2005 degree recipients placed themselves in the "general" or "other" category.
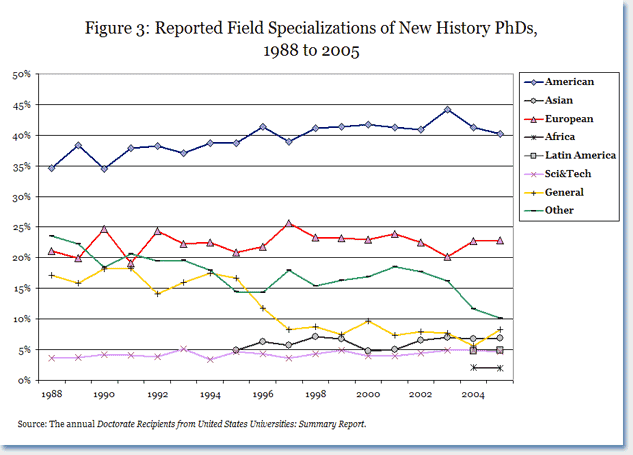
As indicated in Figure 3, the proportion of American historians in the new cohort dipped for the second year in a row, though still remaining fairly high. Between 1975 and 1990, American historians averaged just 35.5 percent of the degrees conferred. Over the past five years, they earned an average of 41.6 percent of the new PhDs.

In European history the trend moved slightly in the opposite direction. Between 1975 and 1990, Europe specialists earned an average of 24.7 percent of the degrees conferred. Over the past five years, they received an average of 22.4 percent of the degrees.
Regrettably, the federal survey separated out Asian history only a decade ago, and African and Latin American history even more recently, in 2004; so we cannot usefully plot similar long-term trends for those fields.
Who Earned the PhD?
The federal survey of earned doctorates is particularly valuable for the rich demographic picture it provides about the new cohort of history PhDs. This snapshot from 2005 reveals a cohort of PhD recipients who are similar to their predecessors in many respects, but who took a longer time to receive their degrees.
The 2005 history PhD recipients spent an average of 10 years registered for courses after the baccalaureate degree, the highest average on record. As a result, the median age for these new history PhDs also rose to 35.3, which was also a record for this survey.
It should be noted that this is not too far off the average for other fields. Among all the humanities fields, the average time spent enrolled in post-baccalaureate courses was 9.7 years, and the median age was 35.2.
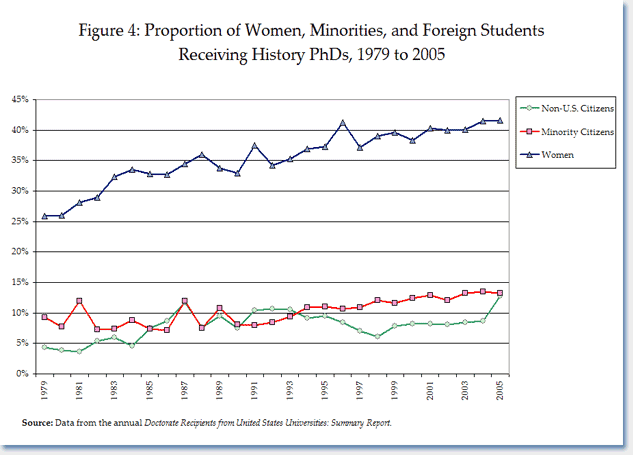
The proportion of women receiving history PhDs also reached a new high of 41.6 percent (Figure 4). It is worth noting, though, that this was a barely perceptible increase from last year's high of 41.5 percent and remains well below the average for the non-science fields, where women comprise 50.9 percent of the new PhDs.

In contrast, the proportion of minorities among the cohort of new history PhDs slipped by a tiny margin, from 13.5 to 13.3 percent of the U.S. citizens receiving the degree. This proportion is significantly lower than the average for all disciplines, which is 20 percent of the degree recipients. African Americans comprised 5.4 percent of the new history PhDs, while Hispanic/Latino Americans accounted for 4.2 percent and Asian Americans comprised 2.9 percent of those receiving the degree.
Curiously, the proportion of students on temporary student visas who received history degrees increased sharply, comprising 12.1 percent of the degree recipients. That was up from just 8.7 percent of the PhD recipients in 2004, and surpassed the previous high point of 11.7 percent in 1987. This is rather puzzling given reports from other surveys of declines in the number of foreign students after 9/11.
Like most of the data in this report, this is only providing a snapshot for one year. Whether this marks the beginning of a new trend or just a transitory phenomenon will only be borne out by time.
—Robert B. Townsend is assistant director for research and publications at the American Historical Association.
Tags: Job Markets
Comment
Please read our commenting and letters policy before submitting.


