News
Number of History PhDs Rising Again, but Job Openings Keep Pace
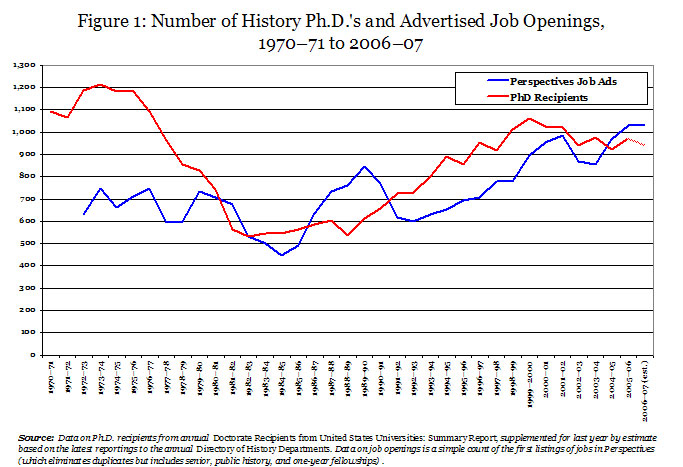
The number of new history PhDs increased 5.3 percent from the 2005 to 2006 academic years, growing from 924 to 973 new graduates. This matched a general increase in the number of new PhDs conferred in all fields, but was almost double the growth in the other humanities disciplines. Fortunately, the number of new job listings in Perspectives kept pace with this increase, rising a full 6.6 percent (from 966 positions to 1,030) over the same span.
Preliminary information for the most recent academic year offers additional good news, as the number of new degrees reported to the annual Directory of History Departments for 2006–07 dipped modestly, while the number of job openings rose again (albeit just 0.2 percent) (Figure 1). Typically, shifts in the number of PhDs reported to the Directory are reflected in the corresponding federal survey of earned doctorates. So the 3.5 percent decline in the number of PhDs reported to the Directory suggests the 2007 survey will report approximately 940 new history PhDs. If that estimate is accurate, this is the first time in the past 25 years that the number of job openings exceeded the number of new PhDs for three consecutive years.
Demographics of the 2006 PhD Cohort
The annual survey of earned doctorates is prepared by the National Opinion Research Center (NORC) for five federal agencies, and provides the most accurate measure of new recipients of research doctorates.1 Every student receiving a PhD is asked to fill out the survey before they graduate (usually with strong encouragement from their school), so it provides the most comprehensive and detailed snapshot of who is receiving the degree.
The survey provides the best measure of how long it takes to complete a doctorate in history relative to other fields, offering clear evidence of the long path to the PhD. The new cohort of history PhDs finished their degree an average of 12 years after their undergraduate degree, and an average of 9.7 years after starting graduate school. The median age of the new cohort of history PhDs was 35.5 years—an increase of more than a year within the past decade.
The time taken to earn a history PhD is in line with the other humanities disciplines, however. On average, doctoral students in the humanities spent 9.7 years registered for graduate-level classes. In comparison, among the social science disciplines the average was just 7.9 years at the graduate level. The median age was 35.0 years for humanities PhDs, but 32.9 for new degree recipients in the social sciences.
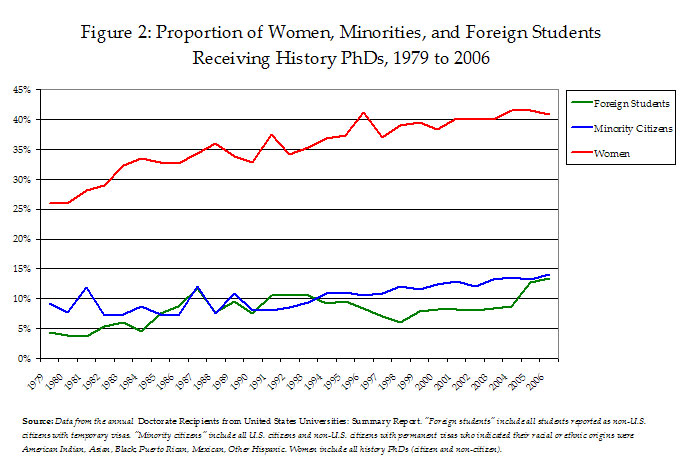
The NORC survey also allows us to track long-term data on the demographics of new history PhDs. The proportion of women in the new cohort of history PhDs fell for the third time in the past 10 years, from 41.6 percent to 40.9 percent of the new degree recipients (Figure 2). History is markedly different from the other humanities and social science disciplines in the proportion of women earning degrees in the field, as women earn an average of 50.6 and 57.4 percent of the PhDs respectively in those fields.
However, after declining slightly in the previous year, the representation of minority students among the new cohort of history PhDs rose from 13.3 percent to 14.1 percent. In absolute numbers, 139 of the 807 U.S. citizens who received history PhDs classified themselves as members of a racial or ethnic minority. Among U.S. citizens in the humanities, 13.6 percent of the new doctoral students were minorities, while 17.5 percent of the new doctoral recipients in the social sciences were minorities.
There has also been a marked increase in the number of foreign nationals earning history degrees over the past two years—growing to over 13.5 percent. In 2006 the representation of foreign students almost achieved parity with the proportion of minority students for the first time in more than a decade.
Changes among the Fields
The growth in the number of history PhDs tracks with the larger trends in the number of doctorates conferred. The 45,596 research doctorate degrees conferred by 417 universities in 2006 were the largest number of new PhDs conferred in the United States. In relative terms history PhDs accounted for 2.1 percent of the new degrees for the second year in a row, still above the low point of just 1.8 percent in 1992–93. And history grew slightly among the other humanities disciplines, where it now comprises 17.4 percent of the PhDs conferred, rising from a low point of 15.1 percent in 1989.
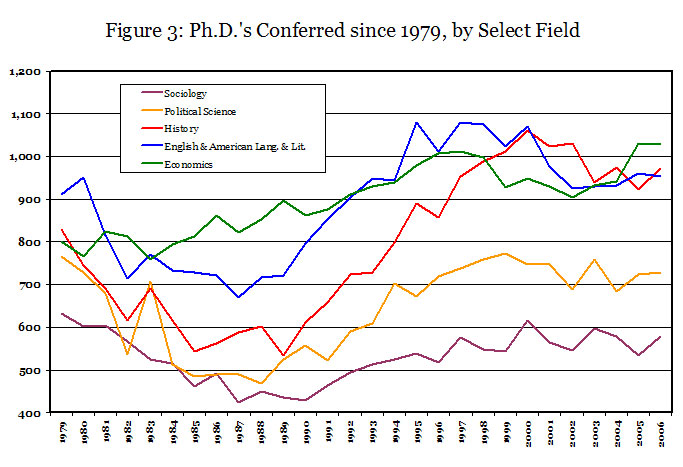
Even though the number of new history PhDs has been running below the peak reached in 2000, the increase in the number of history PhDs in 2005–06 lifted history above most of the other humanities and social science fields (Figure 3). Only the social science fields of economics and psychology conferred more degrees in 2006.
The sharp increase in the number of history PhDs between 2005 and 2006 seems quite pronounced—but viewed over the longer term, the annual number of new history degrees has been relatively stable over the past six years. The number of history degrees fell sharply from the early 1970s and into the 1980s, and then nearly doubled from 1989 to 2000. Over the past four years, however, the number of new history degrees has been comparatively steady, hovering around 950 degrees per year.
The other humanities and social sciences degrees also seem to be lingering on similar plateaus over the past few years. Between 2005 and 2006, the number of new PhDs in English and American languages and literature fell 0.6 percent, while the foreign languages rose 0.6 percent. The “other humanities” (including American studies, philosophy, and religion) rose 2.9 percent. The number of new PhDs in economics fell 0.2 percent, while political science and sociology increased 0.6 percent and 8.0 percent respectively.
Within the history discipline, American history continues to be the largest field of study by a sizeable margin, comprising 40.2 percent of the degrees in the discipline. This is below the high point the field achieved four years earlier, when American history accounted for 44.1 percent of the new history doctorates, but still well above the other subject fields. The second largest field, European history, comprised 22.5 percent of the new PhDs.
Specialists in other regions of the world increased their representation between 2005 and 2006. The number of PhDs conferred in Asian history rose from 6.9 to 8.2 percent, degrees in Latin American history grew from 4.9 to 5.0 percent, and specialists in African history expanded from 1.9 to 2.8 percent.
The larger picture is muddled a bit by the other field categories the new degree recipients can select, including the history of science and technology (5.8 percent), “general history” (6.1 percent), and “other history” (9.8 percent). These could represent specialists whose topical interests fall into one of the other categories, fall into a geographical area that is not represented (such as the Middle East), or represent some other type of transnational history.
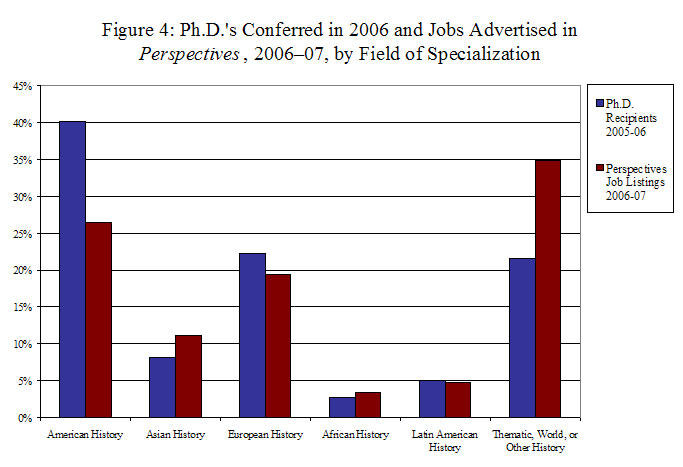
The ambiguities about the field specializations that new degree recipients select in responding to the survey injects some ambiguity into any comparisons between the job listings and the track of new degree recipients. But a comparison can still be instructive. The alignment between job offerings listed in Perspectives last year and new PhDs earned the year before show some of the problems between supply and demand in the academic job market (Figure 4).
Job listings for positions in American history, for instance, were a third less than the number of new PhDs conferred the year before. And openings in European history fell 13 percent below the number of new degrees. In comparison, the number of openings in Asian and African history were higher than the number of new degrees, and the listings for Latin American history were near parity.
Such comparisons need to be read with considerable care, of course. The apparent correspondence between specific topical and geographical specializations can be widely varied within those broad categories. And specialists in any of the fields with a severe imbalance might be eligible for the large number of thematic and open positions, as well as any number of openings for historians outside of academia.
And as any serious job candidate knows, the listings in Perspectives do not encompass the full universe of job openings they could apply. Openings have always been advertised in other national and local publications as well, and are now also distributed through online media. Nevertheless, the Perspectives job listings have provided a good barometer of the relationship between jobs and candidates over the past 33 years.
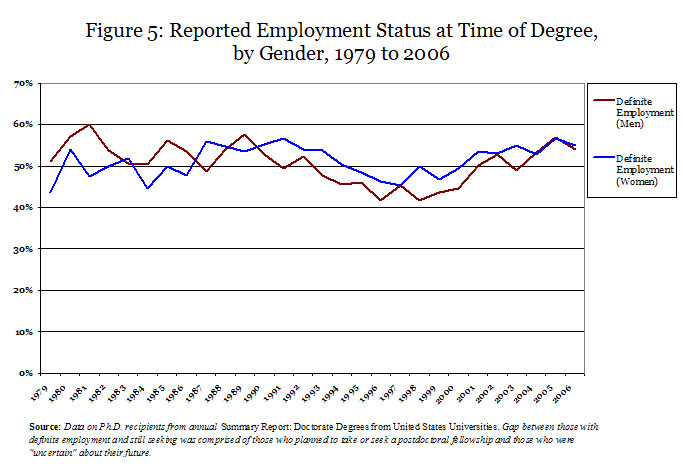
Some confirmation of this can be found in the proportion of new degree recipients reporting definite employment at the time of degree. In the 2006 cohort, 54.4 percent of the new history PhDs reported “definite” employment. This marked a modest decline from the year before, but it was still much higher than it had been during the lean years of the 1990s (Figure 5). The 28.0 percent of new doctorate recipients who reported they were still “seeking employment” at the time of their degrees marked a more positive improvement. The remaining 17.7 percent who are not accounted for in these calculations were either entering some kind of postdoctoral study, still negotiating a contract, or lacked any definite plans for future employment.
The employment prospects for both men and women appear to be about equal at the time of degree (Figure 5). For the past three years essentially the same proportion of each gender reported they had definite employment at the time they received their degrees. This is in marked contrast to the 1980s when male history PhDs enjoyed a modest advantage in finding employment, or the 1990s, when female history PhDs appeared to have a slight advantage.
—Robert Townsend is the AHA's assistant director for research and publications. Additional reports and data can be found on the AHA’s web site.
Note
1. Thomas B. Hoffer, et al., Doctorate Recipients from United States Universities: Summary Report 2006 (Chicago: National Opinion Research Center, 2007) available online at http://www.norc.org/projects/Survey+of+Earned+Doctorates.htm. The NORC numbers are higher than those reported to the AHA’s annual Directory of History Departments, Historical Organizations, and Historians, because they allow new PhDs to self-select the field of their degree. The NORC survey thus includes the dozens of American studies, area studies, and other field specialists who may not appear in the AHA directory, but compete in the history job market—and must, therefore, legitimately find a place in the computations.
Tags: Job Markets
Comment
Please read our commenting and letters policy before submitting.


