News
Openings and New PhDs on the Rise
The 2012 Jobs Report
The number of job openings advertised with the AHA in the 2011–12 academic year increased by 18 percent over the year before—rising for the second time in a row. Unfortunately, other evidence shows the competition for academic positions also continued to grow, and the squeeze on full-time faculty positions continued.
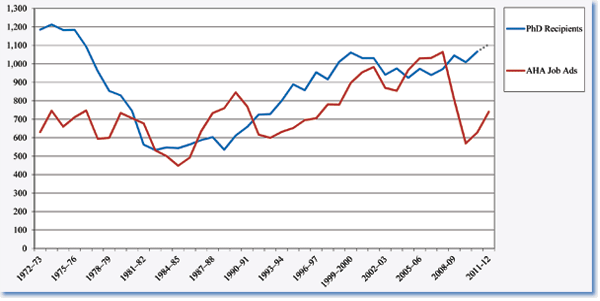
Between June 1, 2011, and May 31, 2012, employers posted 740 positions with the AHA. This is up from a nadir of 569 positions in the 2009–10 academic year, but still well below the all-time peak of 1,064 jobs offered in 2007–08 at the precipice of the recent recession (Figure 1).
Figure 1: Number of History PhDs and Advertised Job Openings, 1970–71 to 2011–12

Despite the increase in the number of jobs available, there was a slight (0.3 percent) contraction in the number of full-time faculty actually employed in the 686 departments listed in the AHA's Directory of History Departments and Historical Organizations over the past two years. While 187 departments reported a net increase in the number of full-time faculty, and 333 departments were unchanged, 166 departments experienced a net reduction of one faculty member or more when compared to the previous academic year.
Similar small contractions in the number of full-time faculty over the past three years have eroded the real gains in the number of faculty that occurred between 2002 and 2007. Yet even now, the number of full-time faculty members in history departments remains 5.9 percent higher than in the 2001–02 academic year.
The number of adjunct and part-time faculty members listed also decreased over the past year, albeit by only 1.1 percent. The Directory is a less reliable indicator of the actual trends in the use of contingent faculty appointments, since employees on short term contracts are less likely to be listed. Even with that caveat, however, the number of part-time and adjunct faculty listed has increased by 8.9 percent over the past 10 years.
Looking toward the future, the number of doctoral students completing PhDs and still working toward the degree continues to grow. The federal government reported in December 2012 that 1,066 new history PhDs were conferred in the 2010–11 academic year—a 5.6 percent increase over the year before. And the number of PhDs reported to the annual Directory for the 2011–12 academic year suggests that number will continue to grow, as departments reported another increase of 3.7 percent.1
Changing Patterns in Entry-Level Openings
The number of advertisements for entry-level academic positions increased, but more slowly than the growth in all advertised openings (which includes offerings for senior faculty and employment outside academia). Positions open to instructors and assistant professors increased 17.4 percent over the prior year, from 470 to 552 positions.
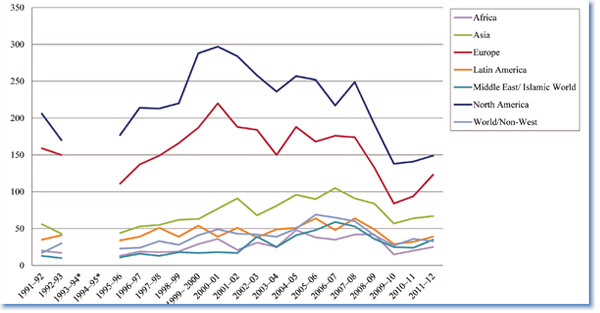
The good news (such as it is) for applicants is that growth occurred in every major geographical category except world history over the past two years (Figure 2). The largest increases occurred in the fields of European history (up 30.9 percent) and the history of the Middle East and Islamic world (up 45.8 percent).
Figure 2: Number of Entry-level Positions Advertised in Geographic Subject Field, 1991–92 to 2011–12

The increase in openings for European history is particularly notable, as advertisements in that field fell earlier and faster than in the other fields during the recession, and until this year, appeared to be recovering much more slowly than the rest.
Conversely, it appears that openings in the history of North America are now lagging well behind even as the job market recovers. The number of junior faculty positions offered for specialists in the history of the U.S. and Canada increased only 5.7 percent last year, and has increased by just 8.0 percent since the bottom of the recession in 2009–10. Perhaps most worrisome for the field, even with the recovery, the number of entry-level job postings in North American history now stands at barely half the number posted at the peak for the field 10 years ago (149 as compared to 297 in the 2000–01 academic year).
The situation for specialists in U.S. history is not quite as dire as it may initially appear from this tabulation. Academic departments listed another 81 entry-level positions without a specific geographic specialty, many of which were clearly open to specialists in U.S. history. A number of those—such as the nine positions advertised for academic appointments in public history—actually express a preference for historians of the United States, albeit with additional technical qualifications.
Similarly, there was a sharp increase in the number of openings for digital history in the past year. Over the past year, 10 positions (7 entry-level openings and 3 postdocs) specified this area as the primary field of specialization. Notably, however, most of these positions were listed as encompassing "digital humanities," potentially bringing historians into competition with other disciplines.
In all, 32 positions advertised with the AHA last year (over 4 percent of the total advertised) mentioned digital skills as a benefit for aspiring applicants. These jobs ranged from seemingly traditional academic appointments (in fields such as early American and modern Latin American history) to a number of public history positions outside the academy.
The "digital" field has seen marked growth over the past decade. Only three positions even mentioned digital history back in 2003–04, and 10 positions made a similar request in 2008–09.
The Challenges for History PhDs (New and Old)
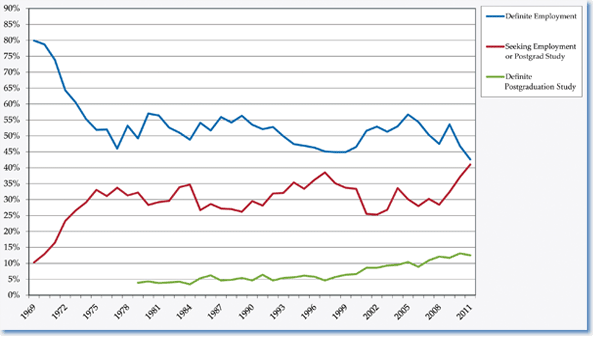
In the course of the recent recession, the number of new history PhDs reporting employment at the time they earned the degree has fallen to unprecedented lows. According to the annual federal Survey of Earned Doctorates, just 42.6 percent of the new history PhD recipients in 2011 reported definite employment as they graduated—the lowest level in 43 years of accumulated data (Figure 3).2
Figure 3: New History PhDs Reporting Employment or Other Postgraduation Plans at Time of Degree, 1969 to 2011

Some of the difference was made up by a substantial number of graduates taking postdoctoral fellowships and similar intermediate positions. Among the 2011 cohort, 12.5 percent reported taking up some form of "postgraduation study."
The number of new history PhDs taking up postdoctoral positions has increased substantially since the early 1990s, serving as a temporary shelter for new PhDs in economic hard times. In 1993, only 5.4 percent of the new history PhDs reported taking postdoctoral positions.
Despite the available postdoctoral positions, an unprecedented number of new history PhDs (41 percent) reported they were still seeking work or postdoctoral study when they earned their degrees. As recently as the 2009 cohort, less than 29 percent of the new history PhDs reported they were still casting about for another opportunity.
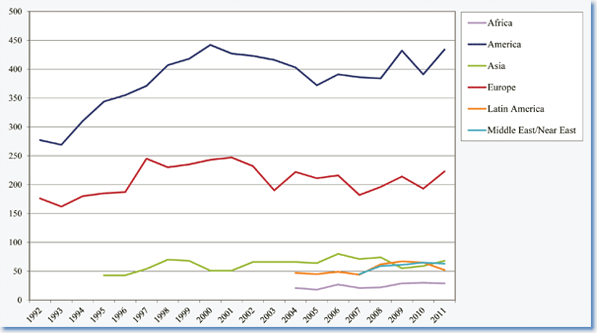
The distribution of specializations among new PhDs demonstrates why the competition is growing for many positions (Figure 4). The number of new PhDs identifying their specialization as American history, for instance, has been averaging about 400 over the most recent four years of the federal survey, even as the number of advertised openings fell sharply. And that number increased 11 percent from 2010–11, to a total of 434—the second highest level in the past 20 years. The number of specialists in European history also increased in the most recent year of the survey—growing 15.5 percent, to 223 new PhDs.
Figure 4: PhDs in History Subject Fields, since 1992

Graduates in the other geographic fields of history generally declined slightly. The number of African history PhDs dipped from 30 to 29, while new PhDs in Middle East and Islamic world decreased from 65 to 63, and in Latin American history from 65 to 52.
Even in fields with small decreases in the number of new PhDs, the newest members of the discipline find themselves competing with a large number of PhDs who have been on the academic job market for a year or more.
The challenge is most evident in the steadily rising number of applications for each entry-level position. We surveyed every advertiser from last year, and heard back from a third of them (accounting for 184 positions). With the exception of African history, respondents in all fields reported an increase in number of applicants—in some cases, to levels not seen since our first survey of advertisers during the job crisis of the 1990s.
The number of applications for positions in the history of the U.S., for instance, increased to an average of 118 per opening, very near the high of 120 recorded in the 1995–96 academic year. And the average number of applications to European history positions reached an unprecedented level, at just over 100 per position.
Applications for positions in Asian history also increased to an average of 70.4 per position, while applications for African history fell slightly to an average of 53.2. Applications for openings in Latin American history and the history of the Middle East and Islamic world were essentially unchanged, at an average of 87.1 and 64.3 applications respectively.
The growing number of PhDs lingering on the market is also evident in the growing proportion of new hires who earned their degrees three years or more before they made it onto the tenure track. In the 2003–04 survey, 46.8 percent of the new hires were either ABD or had earned their PhDs within the past year. In comparison, only 39.5 percent of the new hires this past year were just entering the job market.
The increased time spent in transitional positions such as postdoctoral fellowships and part-time faculty appointments is evident in the growing proportion of new hires who are three years or more from the PhD. They accounted for 30.6 percent of the junior faculty hires last year, as compared to just 25 percent in 2003–04.
Little Change in Doctoral Programs
Even with clear evidence of a highly troubled job market for historians in academia, the average number of applicants to doctoral programs in the discipline has generally been trending upward through the recession.
Between the fall of 2006 and the fall of 2011, the average number of applications increased sharply from 74.1 to 116.3 per program. This past year saw the first evidence of a real decline in the reported number of applicants, which dropped just over 12 percent to an average of 102.1 per program.
While the average number of applicants fell, the number of students matriculating into the program remained essentially the same, at an average of 8.4 students per program. Nevertheless, the average number of students working at various stages in their program of study increased slightly, to an average of 59.4 students per program—up from just 54.7 per program back in 2006.
The decision to enter a history PhD program can often consist of a highly complex set of variables, including the desire to study the subject and perceptions of a range of career opportunities at the time of application. According to a half dozen directors of graduate studies consulted for this article, some of the new doctoral students are pursuing doctoral study as an alternative to the wider problems on the job market or due to interruptions in existing careers. But the vast majority of the entering students are still quite traditional—following directly on studies at the undergraduate or master's degree level.
By all indications, the academic job market remains highly challenging for anyone entering the market today, and anyone still struggling to find employment after a number of years. What the future will hold for those just entering doctoral programs—given that it takes an average of eight years to finish the degree—is impossible to tell.
While the job market for history PhDs offers a wide array of opportunities—both inside and outside the academy—almost 80 percent of the new doctorate recipients in the field set their sights on employment in academia. Given the potential for shifts in undergraduate student interest and the rise of online courses (with large class sizes and commensurately smaller staffing needs) the career prospects for history PhDs focused on academia remains cloudy.
Robert Townsend is the AHA's deputy director, and the author of History's Babel: Scholarship, Professionalization and the Historical Enterprise, 1880–1940 (Univ. of Chicago Press).
Notes
1. The list of new PhDs reported to the AHA's Directory of History Departments and Historical Organizations provides information primarily from history departments. The federal Survey of Earned Doctorates gathers information directly from students when they receive their degree. The survey allows respondents to select their field of study (regardless of the department from which they graduated), and thus captures students from a wider array of departments and programs.
2. Data from annual Survey of Earned Doctorates. Tabulation based on respondents who reported postgraduation. Information.
Tags: History News Job Markets Resources for Early Career Resources for Graduate Students
Comment
Please read our commenting and letters policy before submitting.


