History programs in the United States conferred 1,045 new PhDs in 2009—a 7.8 percent increase over the year before, and the second-largest number of history doctoral degrees awarded in a single year since 1977.1 In comparison, the total number of PhDs conferred in the United States grew only 1.6 percent. Note that this number is significantly higher than the initial tabulation of 989 history PhDs published by the National Science Foundation in November 2010, which was used in the annual job market survey published in the January 2011 issue of Perspectives on History.
The sudden increase in the number of new doctorates can be traced to at least two causal factors. The first was a certain amount of “irrational exuberance” (to borrow a term from Alan Greenspan) in history doctoral programs over the past decade. When the number of history jobs in academia seemed to be rising at fairly healthy rates from 1999 to 2007, many history departments steadily increased the numbers of doctoral students admitted to their programs. Some universities even initiated new doctoral programs.
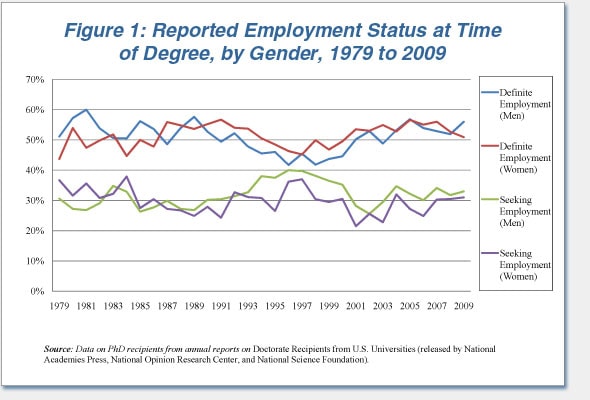
Figure 1
At the same time, judging from interviews with department chairs, it appears that students near completion were encouraged to “hurry and finish up, before things get any worse” (to quote one chair). “Worse,” in this case, was defined either by further declines in the job market or cutbacks in financial support for their doctoral studies. Students in a position to accelerate the completion of their dissertations clearly did so, since the surge in new PhDs awarded was not preceded by a similar sharp increase in the number of listings in our database of dissertations-in-progress (updated annually and available at historians.org/dissertations). Curiously, despite the increase in new PhDs and a substantial drop in the number of advertised jobs in the 2008–09 academic year, the proportion of history PhDs reporting “definite employment” at the time they received their degrees actually increased slightly—from 52.2 percent of history doctoral degree recipients in 2008 to 53.6 percent in 2009 (see Figure 1). The primary reason for the small improvement was a modest increase in the number of history PhDs finding employment outside of academic teaching.
In all, fewer than 30 percent of the new PhDs reported teaching positions in higher education at the time they earned their degrees, which was slightly lower than the average of approximately 32.8 percent for new degree recipients in the humanities. Among new history PhD recipients, 32.4 percent were still seeking employment or postdoctoral study at the time they earned their degrees, 11.7 percent were planning some form of postdoctoral study, and at least 10 percent reported employment outside of academia (in business, government, the nonprofit sector, and secondary education). A small proportion of historians also found nonteaching jobs in academia, but their numbers could not be precisely calculated from the available data.
Viewed by gender, a slightly higher proportion of male history PhDs had definite employment at the time they earned their degrees: 55.6 percent of men receiving doctorates had job commitments, as compared to 50.9 percent of women. This reversed a recent trend where women had been doing slightly better in finding employment by the time they received the degree. Women were more successful at earning postdoctoral slots, however, as 14.2 percent reported definite plans for postdoctoral study, as compared to 9.8 percent of the men.
One of the more striking findings in the survey is a sharp difference in the locations of employment for men and women after earning the degree. Among the new PhDs with definite job commitments, women were more than twice as likely as men to have employment in New England. While 5.6 percent of the male PhDs with jobs found employment in New England, 13.7 percent of their female counterparts had employment there. Conversely, 22.3 percent of men with job commitments were employed in the South Atlantic states, as compared to just 11.3 percent of women. Looking back over the past decade, it appears this disparity in regional employment for men and women in history is not new, but it was certainly the most pronounced in 2009.
Demographics of the 2009 Cohort
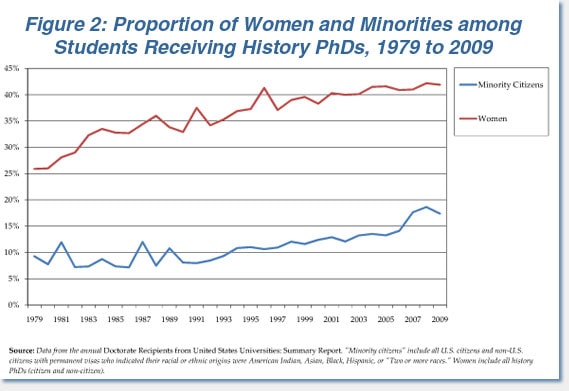
Figure 2
Demographically, the survey showed a slight decrease in the proportion of women and minorities receiving doctoral degrees in the field. Among all history PhD recipients, the proportion of women declined from 42.2 percent in 2008 to 41.9 percent. Among U.S. citizens and permanent residents earning the degree, the proportion of racial and ethnic minorities fell from 18.6 to 17.4 percent (see Figure 2).
The representation of women among history PhDs earned in 2009 is significantly smaller than in other related fields. Women earned 51.8 percent of the new doctoral degrees in the humanities, and 58.4 percent of the PhDs in the social sciences. Among all disciplines, however, women accounted for 46.8 percent of the new degree recipients, due to averages of less than 30 percent in science and engineering fields.
History is closer to the humanities in its racial and ethnic makeup, as 18.7 percent of the PhDs in the humanities fields were minorities. In comparison, among the social sciences and among all fields as a whole, 23.4 percent of the doctorates were conferred on minority candidates.
As in years past, it took significantly longer to complete the history degree than in most other fields. The 2009 cohort of history PhDs completed their degrees in 9.7 years on average after they started graduate school, and 11.3 years after they finished a bachelor’s degree. While this is similar to the other humanities fields, the median for all fields was just 7.7 years after the start of graduate school, and 9.3 years after earning the baccalaureate degree.
Not surprisingly, given that difference in time to degree, the average history PhD was almost two-and-a-half years older than the norm for other disciplines (34.6 years of age, as compared to 32.2 in all fields).
Regrettably, the report does not tell us how the new history PhDs paid for their long journey to degree. But for the humanities overall, 37.5 percent relied primarily on fellowships and grants, 37.9 percent on teaching and research assistantships, and 22.4 percent relied on their own resources. By the end of their graduate studies, almost half of all humanities PhDs accumulated some debt, and 38.6 percent owed more than $10,000.
A Mix of Fields
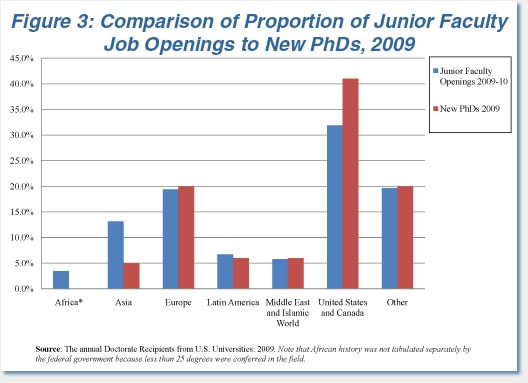
Figure 3
The breakdown in field specializations (see Figure 3) shows a modest increase in the proportion of doctorates conferred in the fields of U.S. and European history. U.S. history, which traditionally accounts for the largest number of PhDs, comprised 41.2 percent of the doctorates awarded in 2009 (up slightly from 39.4 percent). In comparison, European history accounted for 20.5 percent of the degrees conferred (up modestly from 20.2 percent).
The other geographic fields tabulated in the survey each accounted for a little more than five percent of the degrees awarded, including Asian history (5.3 percent), Latin American history (5.4 percent), and Middle East/Near East history (6.4 percent). The other specialized field tabulated in the survey, the history of science and technology, has now grown to 5.8 percent of the doctoral degrees conferred.
The history of the Middle East and the history of science have been the fastest growing fields over the past few years. When the category was added in 2007, Middle East history accounted for just 4.8 percent of the doctoral degrees conferred in the discipline. But the subject field has been growing rapidly given growing interest (and academic positions) since September 11, 2001.
The history of science and technology has also seen a sharp increase over the past few years. The field averaged below 4.5 percent of the new history degrees from 1995 to 2005, but increased to an average of 5.5 percent of the new history degrees conferred from 2006 to 2009.
Regrettably, the field of African history, which averaged less than 4 percent of the new PhDs tabulated in the past five years, was not tabulated as a separate category in the governments report for 2009. They only report that the number of degrees awarded fell below the required threshold of 25. African history was aggregated into the “Other” history category for the year, which now accounts for another 9.2 percent of the degrees conferred.
The shrinking number of jobs presents a problem for new PhDs in all disciplines, but viewed in relative terms the proportion of jobs and PhDs seemed to be approaching parity in a number of geographic fields in 2009. The proportion of jobs and PhDs were quite similar for specialists in European history (at near 20 percent), Latin American history (at near 7 percent), and Middle East and Islamic history (at about 6 percent).
Only the field of Asian history has a significantly higher percentage of jobs than its representation among new PhDs—accounting for 13 percent of the jobs advertised in the last academic year as compared to only 5 percent of the PhDs conferred in 2009. Conversely, the field of North American history has the largest gap between the percentage of jobs and new PhDs—accounting for just 32 percent of the open positions as compared to 41 percent of new PhDs.
This kind of comparison provides little comfort to candidates entering today’s dismal job market, but it does provide evidence of the relative balance in the types of candidates being sought by history departments—and a measure for current and potential doctoral students who may still be considering a field of specialization.
In the interest of full disclosure, the author was among the 2009 cohort of history PhDs and readily admits that he helped to skew the figures for time-to-degree and age upward.
Note
- Division of Science Resources Statistics, Doctorate Recipients from U.S. Universities: 2009 (Washington, D.C.: National Science Foundation December 2010 (NSF 11-306). [↩]